The extreme spread (ES) of velocity is a metric that is often referred to by shooters, and particularly handloaders. As a measure, it is a poor choice of a tool for the purposes for which it is used, particularly when derived from a small number of shots. The Standard Deviation (SD) of the velocity is a superior measure for practical use. A reasonable sample size is required to have confidence in the value of either metric.
Definitions:
ES as I am using it, refers to the difference between the highest and lowest velocity measured from a particular load from a particular rifle. This may be measured from a single string of any number of shots, or as an aggregate over multiple strings of shots. The assumption is that a low ES indicates a consistent velocity from the load/rifle combination.
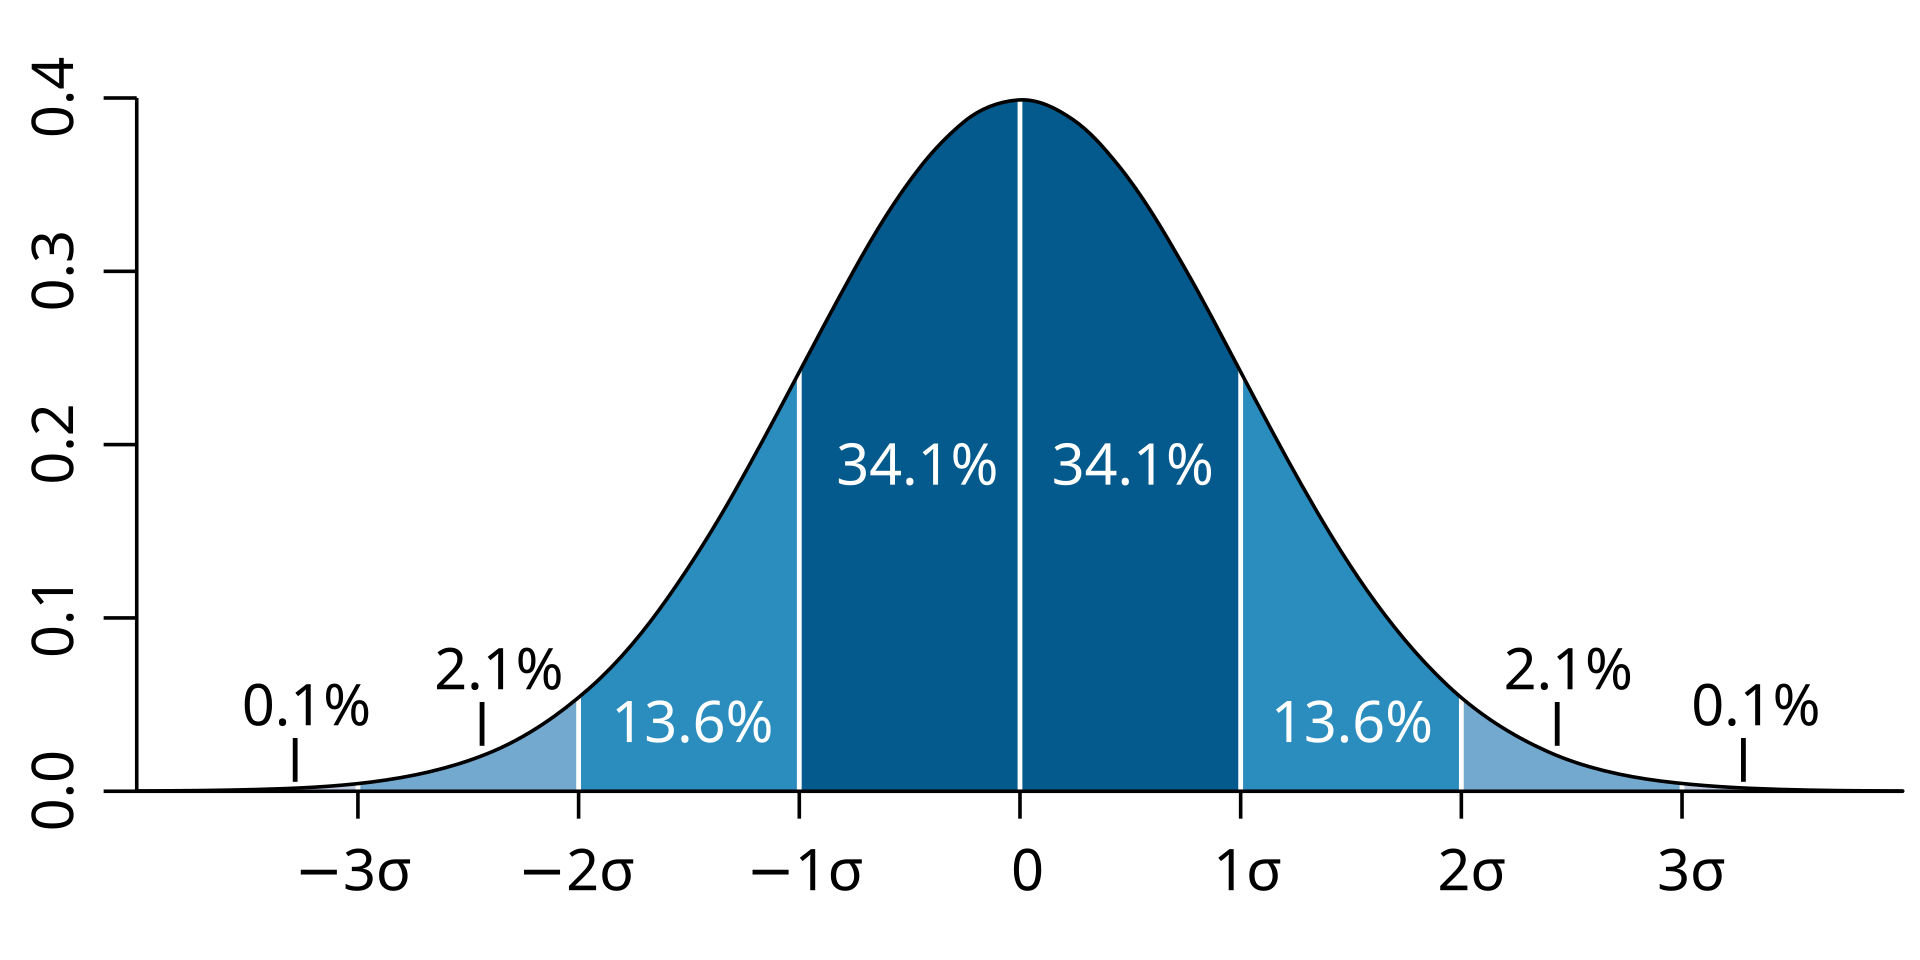
SD is a measure of the variation of the numbers in a population around the average - a low SD indicates low variation in the population. In a population where values follow a normal distribution, 68.2% of samples will have a value within (+ or -) 1 standard deviation from the mean value. 95.4% of values will be within 2 standard deviations, and 99.7% will be within 3 standard deviations of the mean (see image below).
Like a lot of things in the world, velocity measurements from rifle cartridges tend to follow a pretty normal looking distribution - once you get enough samples to fill it out.
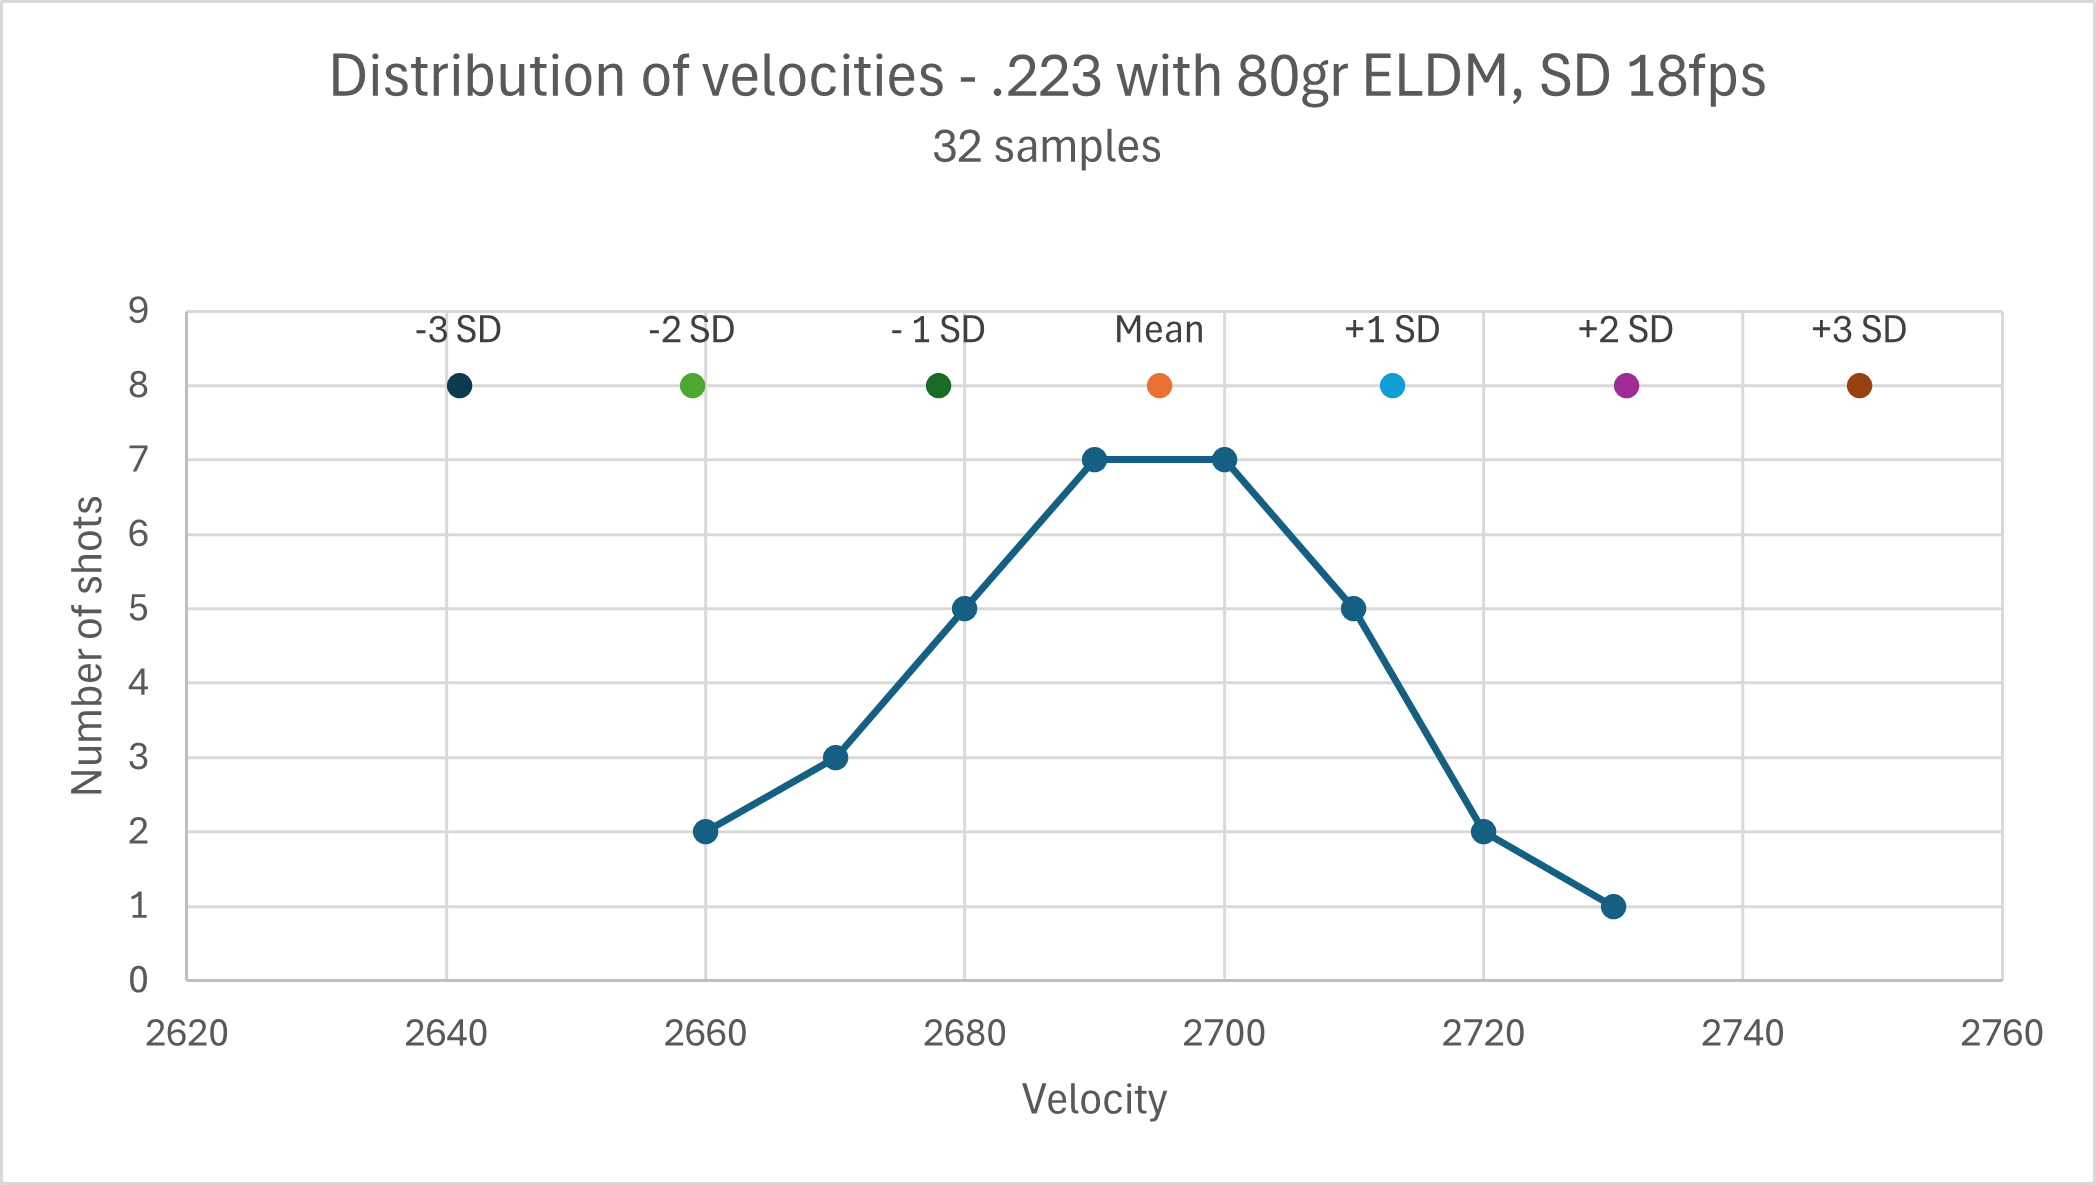
This is a graph of the distribution of 32 shots from a load/rifle combination with an SD of 18. You can see that all measured 32 shots fall within the 95% expected 2SD range - this is expected with such a small sample. Were an additional 68 shots fired to bring it up to 100 shots - a couple of shots should be expected to fall in the 2-3SD range.
What is the ES commonly used for? Frequently the ES is used as a measure of the "quality" of a load when doing load development with an "optimisation" type approach (looking for the 'best' combination of powder charge and seating depth with particular components), on the assumption that different combinations produce different results. A lower ES is assumed to indicate a more consistent load - either as a "better load" for precision, or specifically with the intent of reducing vertical spread at longer ranges.
How well does ES perform these tasks? When you measure velocities from your rifle/load combination, you are taking a sample from a population (the population of all shots that the rifle/load combination could/will ever fire before barrel wear changes velocity, etc). When looking to use the ES, you are assuming that the sample you have taken gives you an accurate enough representation of the population to be useful.
ES as a metric is limited by the fact that it always only uses 2 of however many datapoints from the sample you have taken, and you are relying on these being the values at the extreme ends of the population. The fewer data points you collect in your sample, the lower the probability that these datapoints are representative of the extreme ends of the population - in fact, the fewer data points you collect, the more likely it is that they are NOT the extreme ends - 68% of shot velocities fall pretty close to the average velocity. You are more likely to get a low ES than a high ES, regardless of the consistency of the load.
Let's look at some examples from real 10 shot strings -
Which of these 3 loads is the "best" based on the measured ES ? Well - it depends how many shots you use to measure!
This table shows the relative ranking you'd give each load based on ES at 3, 5, 10 shots - and the actual relative ranking from the SD. These are just 3 strings selected for demonstration purposes - I have thousands of shots of other data in other strings that demonstrate the same point - ES can provide a general picture of how consistent a load is when measured over a larger sample size, however, it is not reliable at 3 or 5 shot strings and will always increase, sometimes dramatically, with additional shots. Why? Because of the high probability of collecting data on shots from near the average velocity, your ES measurement is almost certainly significantly under-representing the true "extreme spread" of the velocities that can be expected from that rifle/load combination. As you fire more shots, the ES will creep upward closer to the true value.
Well, what about SD then? As this table shows, it is also a poor metric at low sample sizes, as far as making relative rankings between loads. (the real story here is that data in small samples isn't very useful, depending what you try to do with it!).
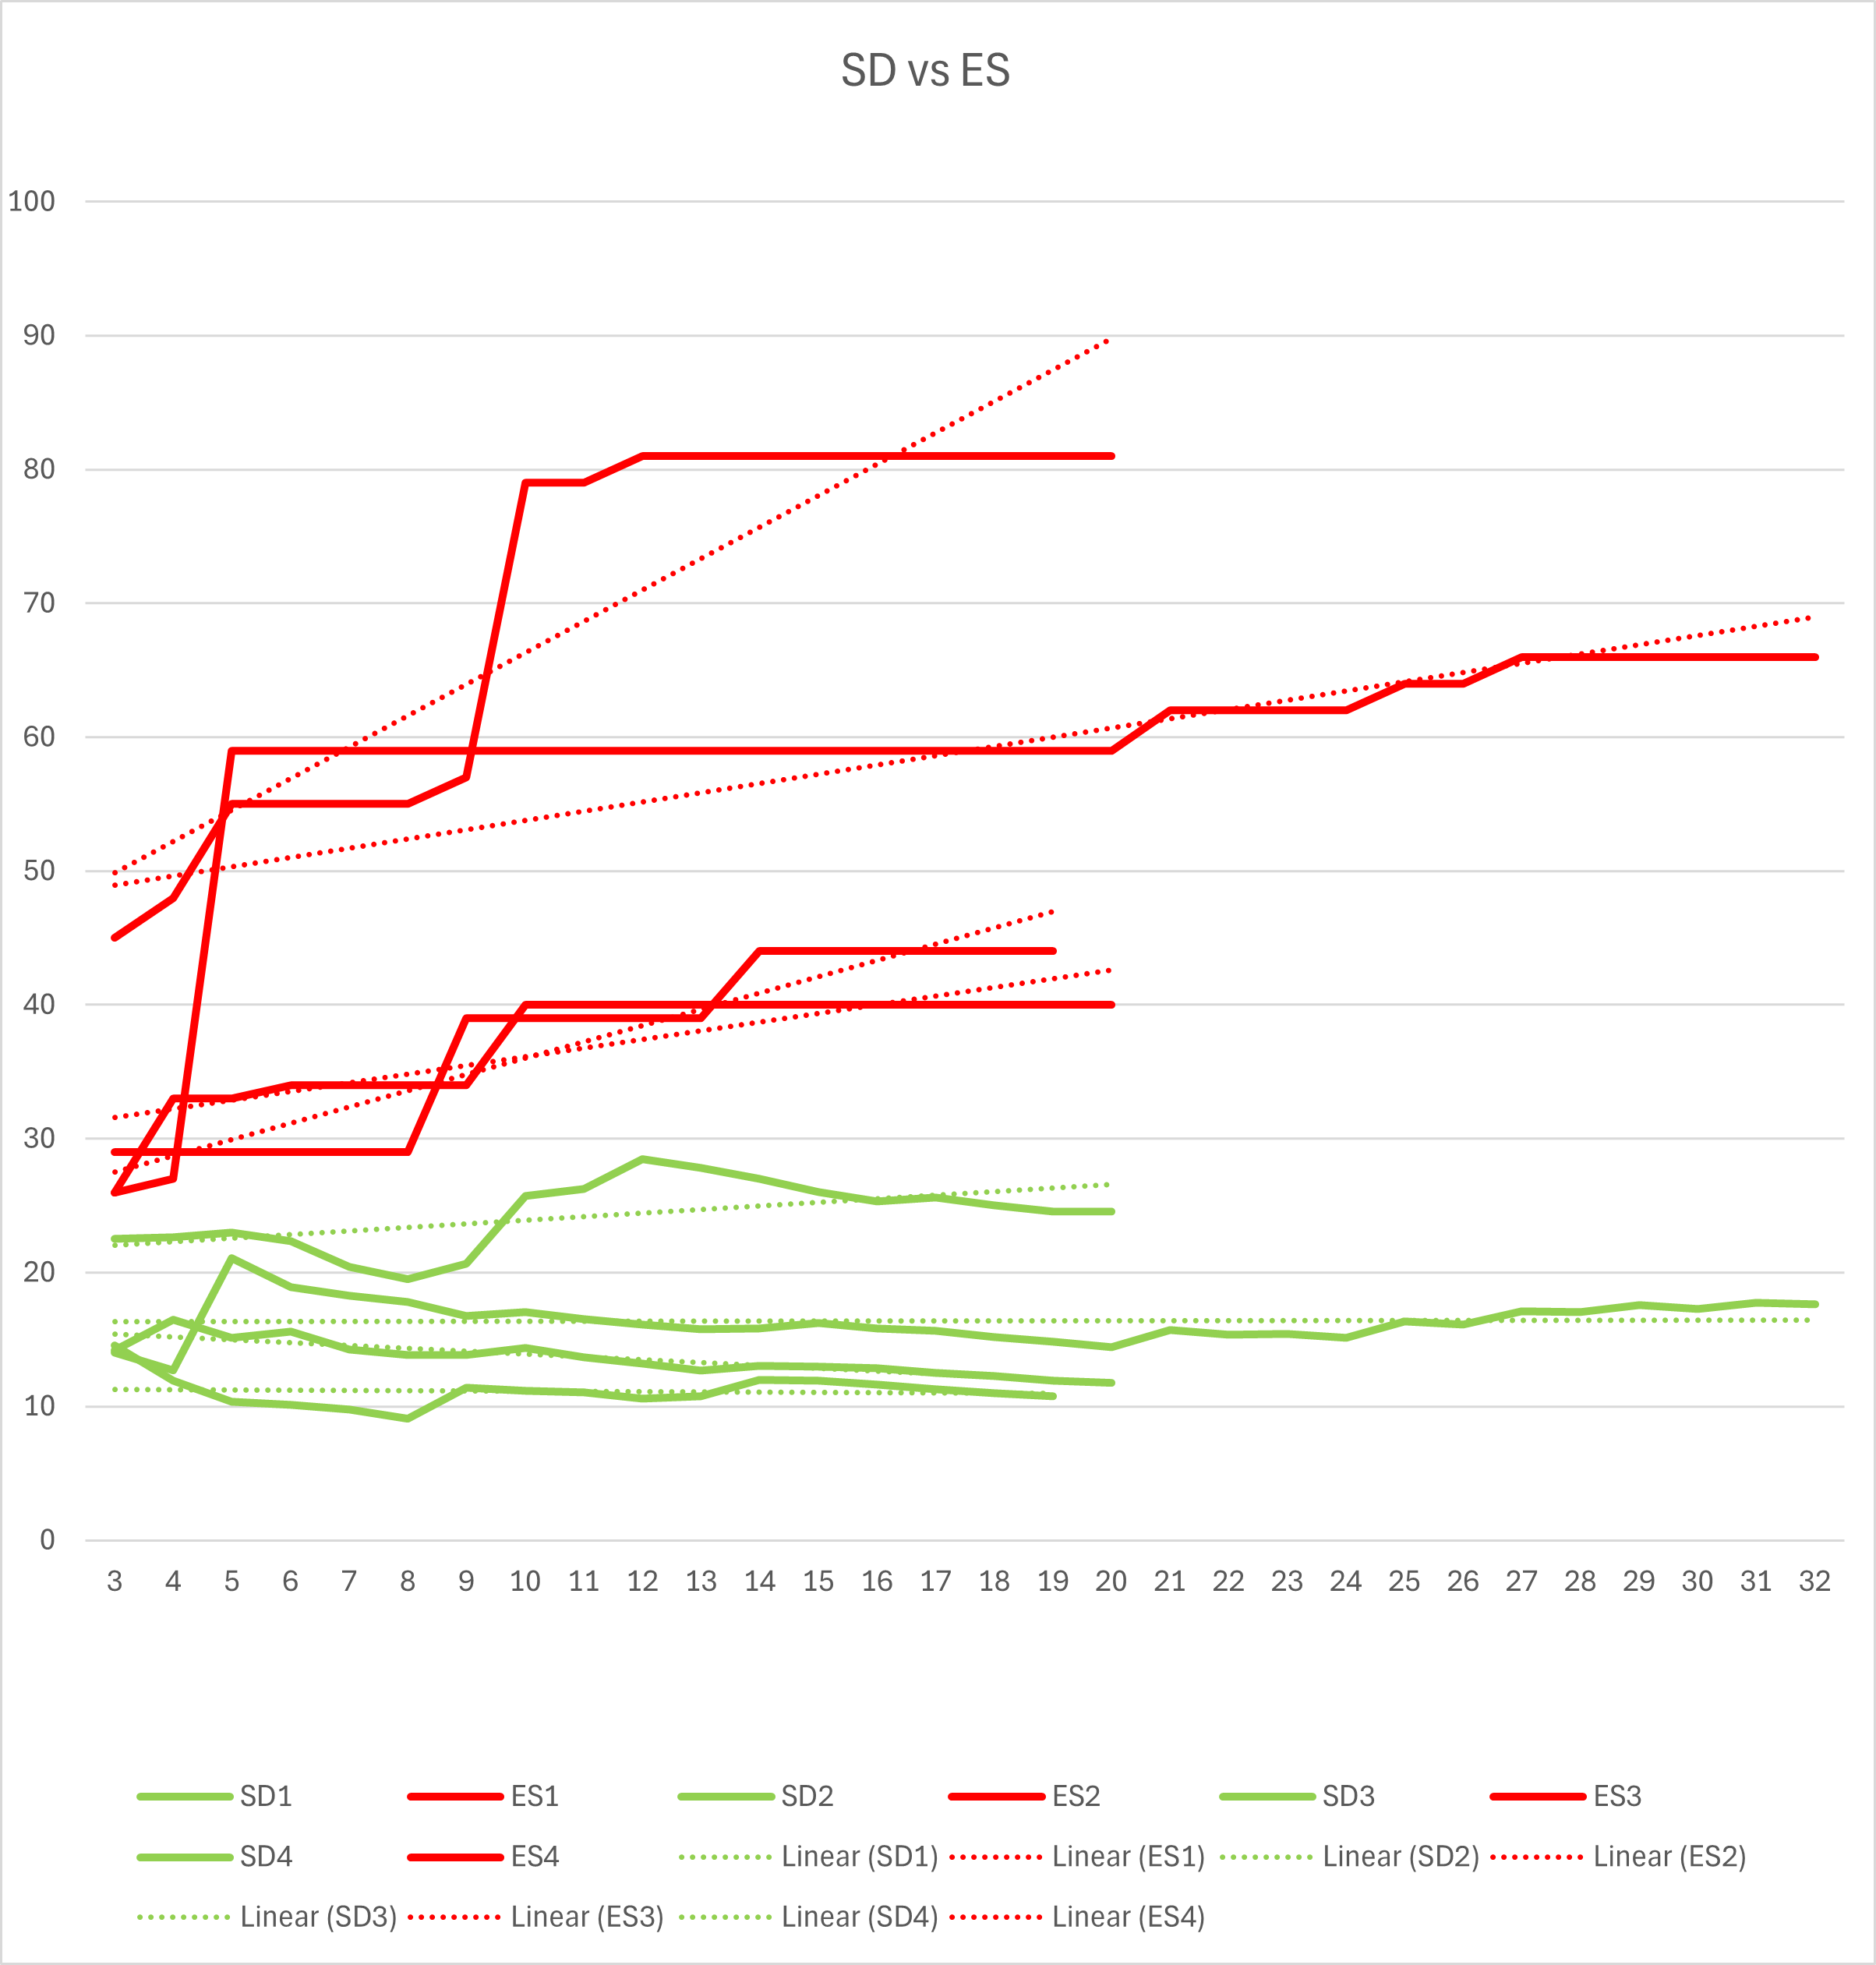
However, as you increase the sample size, the SD does not continue to increase like the ES. Rather, the value will wander slightly up and down. Because the SD uses data from every shot, every shot increases the precision of the number. The SD measurement gets closer to the "true" SD value with every shot you add, whereas the ES just gets bigger. This can be seen in the chart below - red ES numbers continue to rise with additional shots, while green SD numbers oscillate around the "true" value.
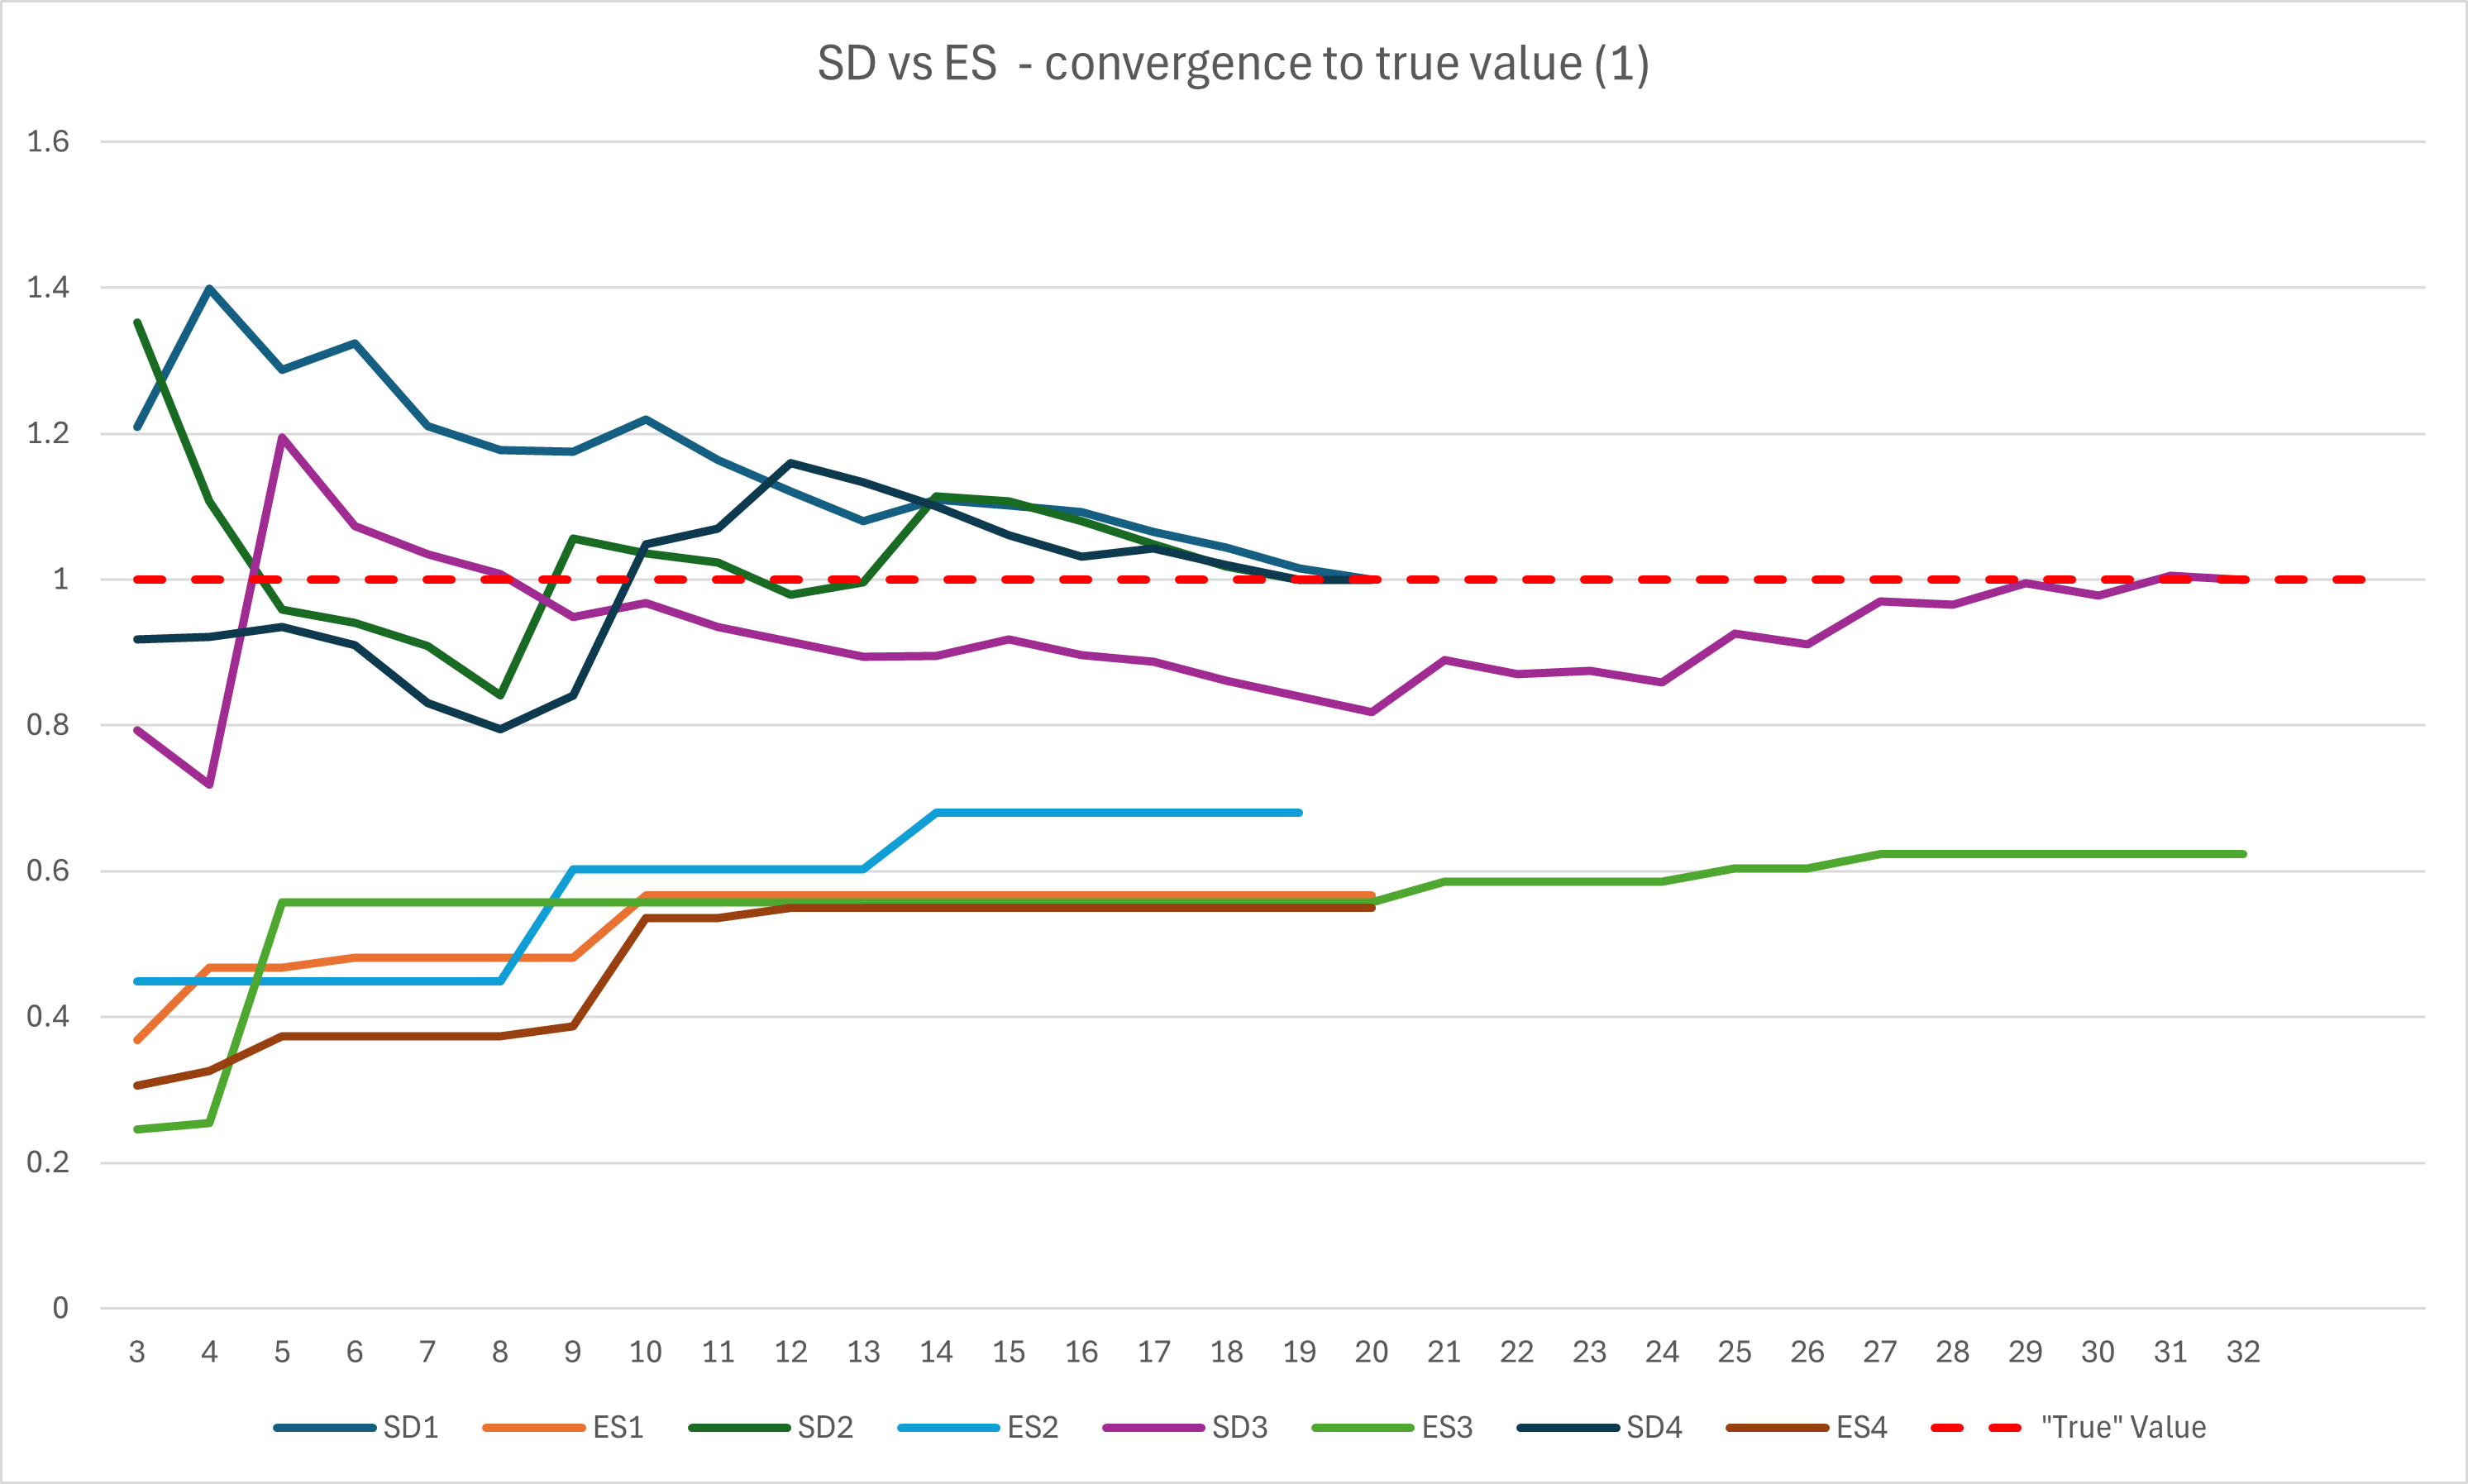
As the SD is a more efficient statistic than the ES, the SD has much lower absolute error than the ES. A calculated SD is much closer to the "true" SD than a calculated ES is to the true ES. The below chart shows this - the "True" values have been given a value of 1, and the relative correctness of each metric for 4 loads (19-32 shot strings) is plotted shot-by-shot sequentially. You can see that within 10 shots, the SD is within about 20% of the "true" SD, whereas the ES progressively climbs towards the true value - but even at 32 shots, never approaches much better than 40% error. The "true" ES can be calculated, if you wish to know it for any reason, by multiplying a reasonably accurate SD by 6 - this gives the range into which 99.7% of your velocities can be expected to fall.
So - if you want to know whether your rifle/load combination is consistent: Use the SD and take a sample of at least 10 shots.
How much should you care about how consistency of the velocity of your load? That's another bonus of using the standard deviation. Using a variety of calculators, the SD can be used (with other inputs) to calculate hit probability. Hit probability dictates your requirements - i.e. what level of consistency, precision, etc, you require for your use.
Using the example of a .284 winchester with a 1.5-2MOA precision (about .1MRAD mean radius) with a 162 ELDM at 2700 fps, and a 200mm dia circle target at 500m:
a 5fps SD gives a 96% hit probability
a 10fps SD gives a 95% hit probability
a 20fps SD gives a 90% hit probability
a 30 fps SD gives a 82% hit probability
This hit probability is based on the random error in the mechanical system and does not account for shooter errors, wind call error, zero offset, etc - shooter proficiency errors swamp the small effects of SD at this range and closer. At 400m, all the above SD values are greater than 95% hit probability. If you are a close range hunter, velocity consistency tells you nothing useful about the real-world performance of your load.
If you are a precision shooter or a longer-range hunter, you may need to care more. However, there is little evidence available that you can do anything to meaningfully change the consistency of your velocity once you have selected components - the evidence currently available seems to be that if you start with a fit-for-purpose cartridge, quality components and a good process using quality equipment, you're likely to get a consistent enough velocity regardless of any other attempts at "tuning". There is certainly no point trying to tune anything based on 3-5 shot testing as shown above.
Welcome guest, is this your first visit? Create Account now to join.
Welcome to the NZ Hunting and Shooting Forums.
Search Forums
User Tag List
+ Reply to Thread
Results 1 to 15 of 18
-
09-01-2025, 01:15 PM #1
Let's talk about velocity Extreme Spread (ES)
-
-
09-01-2025, 01:21 PM #2
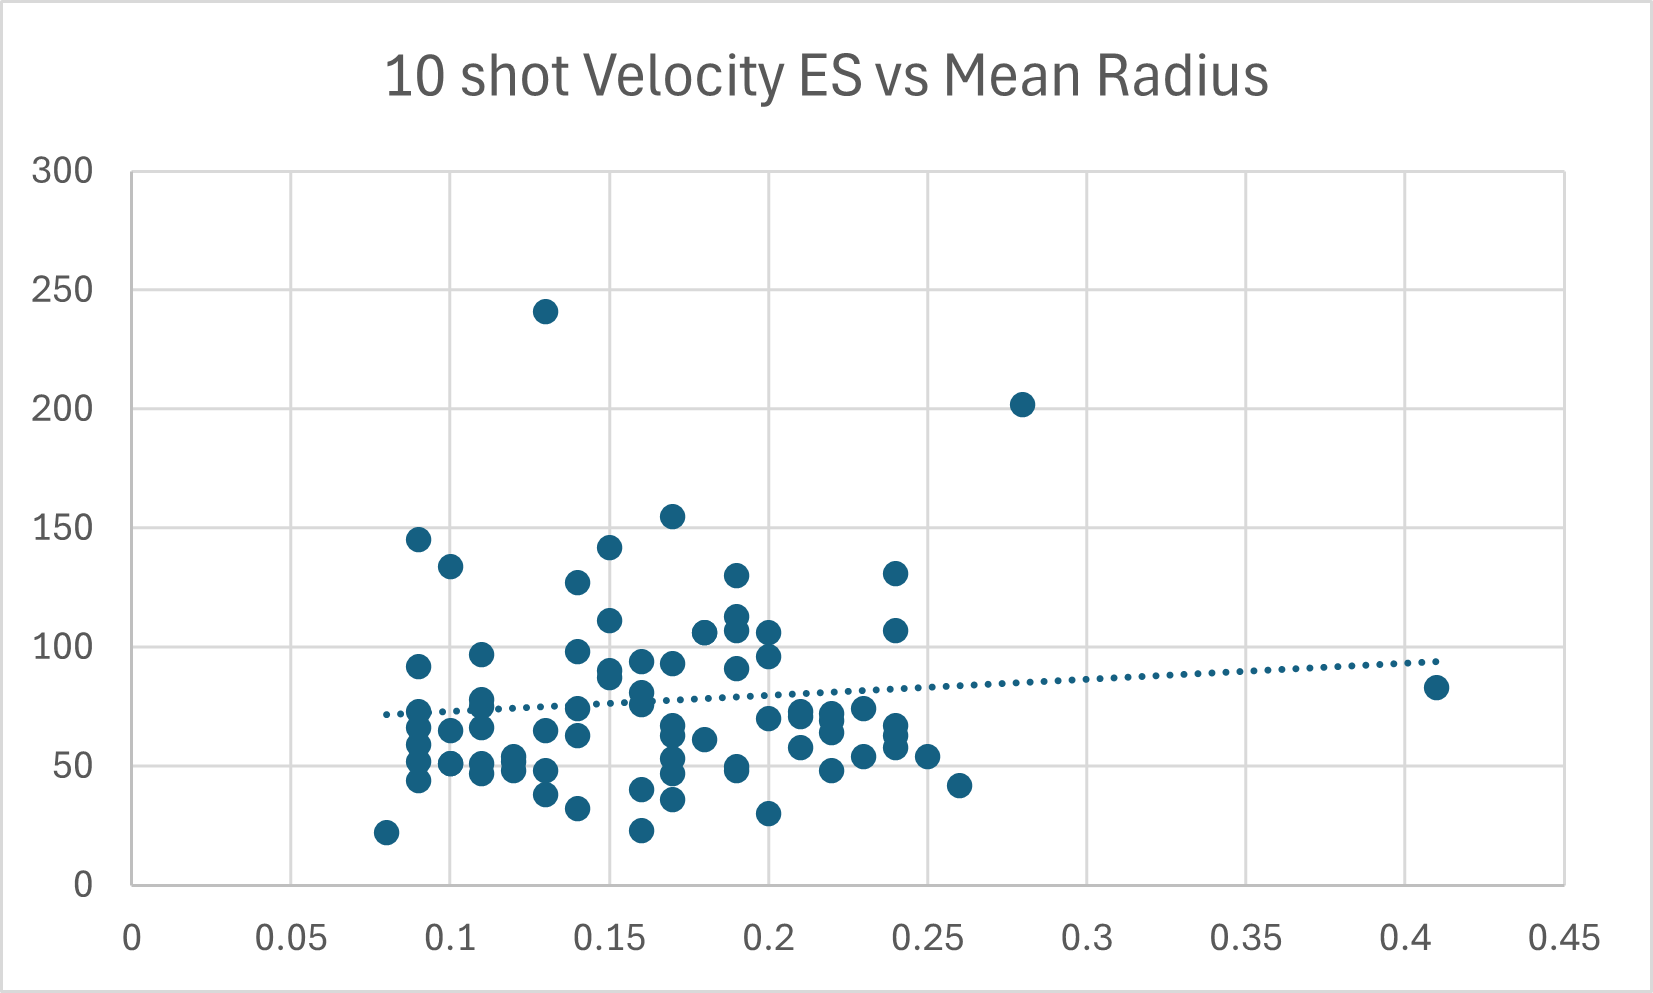
Does ES tell us anything about the quality of a particular rifle/load combination with regards to precision?
Effectively not. There is no significant relationship between 10 round ES and Mean Radius in MRAD across 77 groups fired from 6 or 7 different rifles. This is 10 round ES - a 3 or 5 or other small sample ES will display even less correlation.
-
09-01-2025, 02:23 PM #3Member

- Join Date
- Mar 2012
- Location
- Hastings
- Posts
- 2,919
Great read. Interesting perspective on a "quality" load. Measure that by the performance of the projectile. Usually head and neck shots and the animal does not run... 2m or 5m or whatever. That is also correlated to having manageable recoil [ also known as pleasant and targeted shooting not cringing and wincing every time you fire] 2C.
-
09-01-2025, 02:30 PM #4
-
09-01-2025, 05:38 PM #5Member

- Join Date
- Jul 2012
- Location
- Invervegas
- Posts
- 5,663
Lots to think about from that essay. Thanks for taking the time to assemble and post it.
-
10-01-2025, 01:03 PM #6Member

- Join Date
- May 2020
- Location
- Palmerston North
- Posts
- 277
Now to take it further, let's say you have to choose between load 2 and load 3 with 95% confidence. To compare two SD's you perform an F-Test (in excel).
First calculate the variance of the two samples e.g. var(a1:a10).
Now divide load 2's variance by load 3's variance. 68.7/291.6 = 0.24. This is the F-statistic.
Now get the alpha value. 1-0.95 = 0.05.
Now to check if load 2 is better than load 3: f.inv(alpha, load 2 samples -1, load 3 samples -1) e.g f.inv(0.05, 9, 9) = 0.31 F-critical left.
Because the F-statistic is less than the F-critical left (0.24<0.31), we can say with 95% certainty that load 2 is better than load 3.
Now to check if load 2 is worse than load 3: f.inv.rt(0.05, 9, 9) = 3.18 F-critical right.
Because the F-statistic is less than the F-critical right (0.24<3.18), we cannot say load 2 is worse.
Hopefully I explained this simply enough. I've attached the example excel file.
F-Test.xlsLast edited by Magnetite; 10-01-2025 at 01:18 PM.
-
10-01-2025, 01:34 PM #7Member

- Join Date
- Nov 2020
- Location
- Auckland
- Posts
- 656
a lot of that variation could be due to the cadence of shots fired and the barrel temperature.
I faff incessantly with my neck tension, depth, annealing, weighing charges to .02gn etc etc.
If i get trigger happy and shoot too quick my ES becomes rather embarrassing even with a match grade thick barrel.
Shoot the strings real slowly i say.
-
10-01-2025, 01:48 PM #8
I haven't bothered with statistical tests for any of this, because the point really is that it's totally futile trying to determine which load is "best" with these noisy and variable metrics, particularly with low sample sizes. Within the realm of functional usefulness - set a value for SD that meets your functional requirements and select a load that meets that, move on and use it.
If you think you require an SD of 10fps (along with other requirements) for good hit probability on deer out to 600m, and you test a load which gives an SD of 9 for 10 shots - sweet, it's good enough. On another day and another 10 round string it might give an SD of 11. It's still close enough to your requirement. You're talking 94 vs 92% hit probability. The "True" SD might be 8, 10, 12. It is close enough for functional purposes. Load 100 and go practise calling the wind.
-
10-01-2025, 01:49 PM #9
Always thought ES as fairly meaningless & easily distorted by one or 2 outliers (high or low). I’m much more interested in the consistency of bulk of data. And SD is easy way to assess that quantitatively
-
10-01-2025, 02:02 PM #10
I haven't seen any evidence that barrel heat causes any decrease in velocity consistency.
If there were an effect, you'd expect that the 5rd SD measured after 0-5 rounds would be consistently and measurably lower than the 5rd SD measured after rounds 6-10 from a continuous 10 round string.
Here's a quick paired bar chart of that from 11x 10 shot strings - there's no clear trend at all.
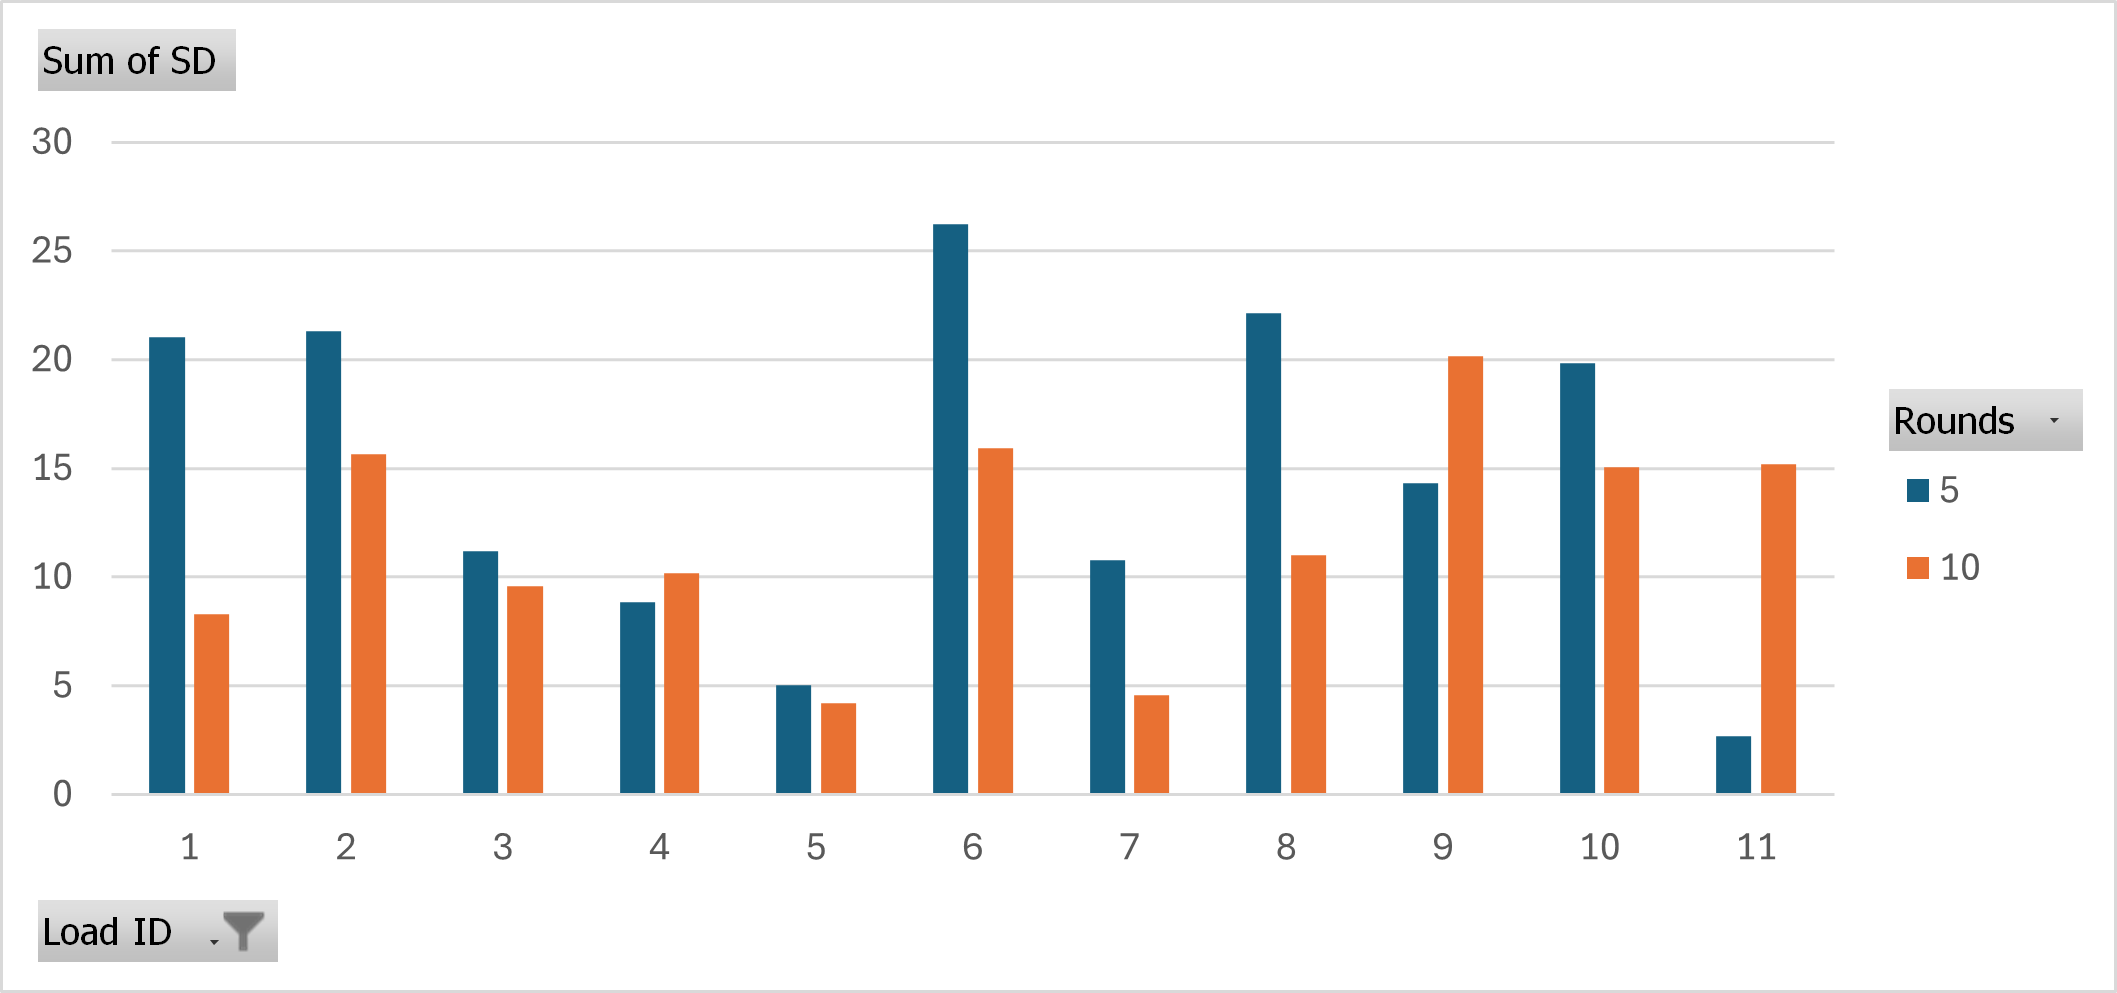
I now shoot 10 round strings for everything with no consideration for barrel heat. With good components etc I still get good SDs.
-
10-01-2025, 02:14 PM #11Member

- Join Date
- Sep 2019
- Location
- Greytown
- Posts
- 323
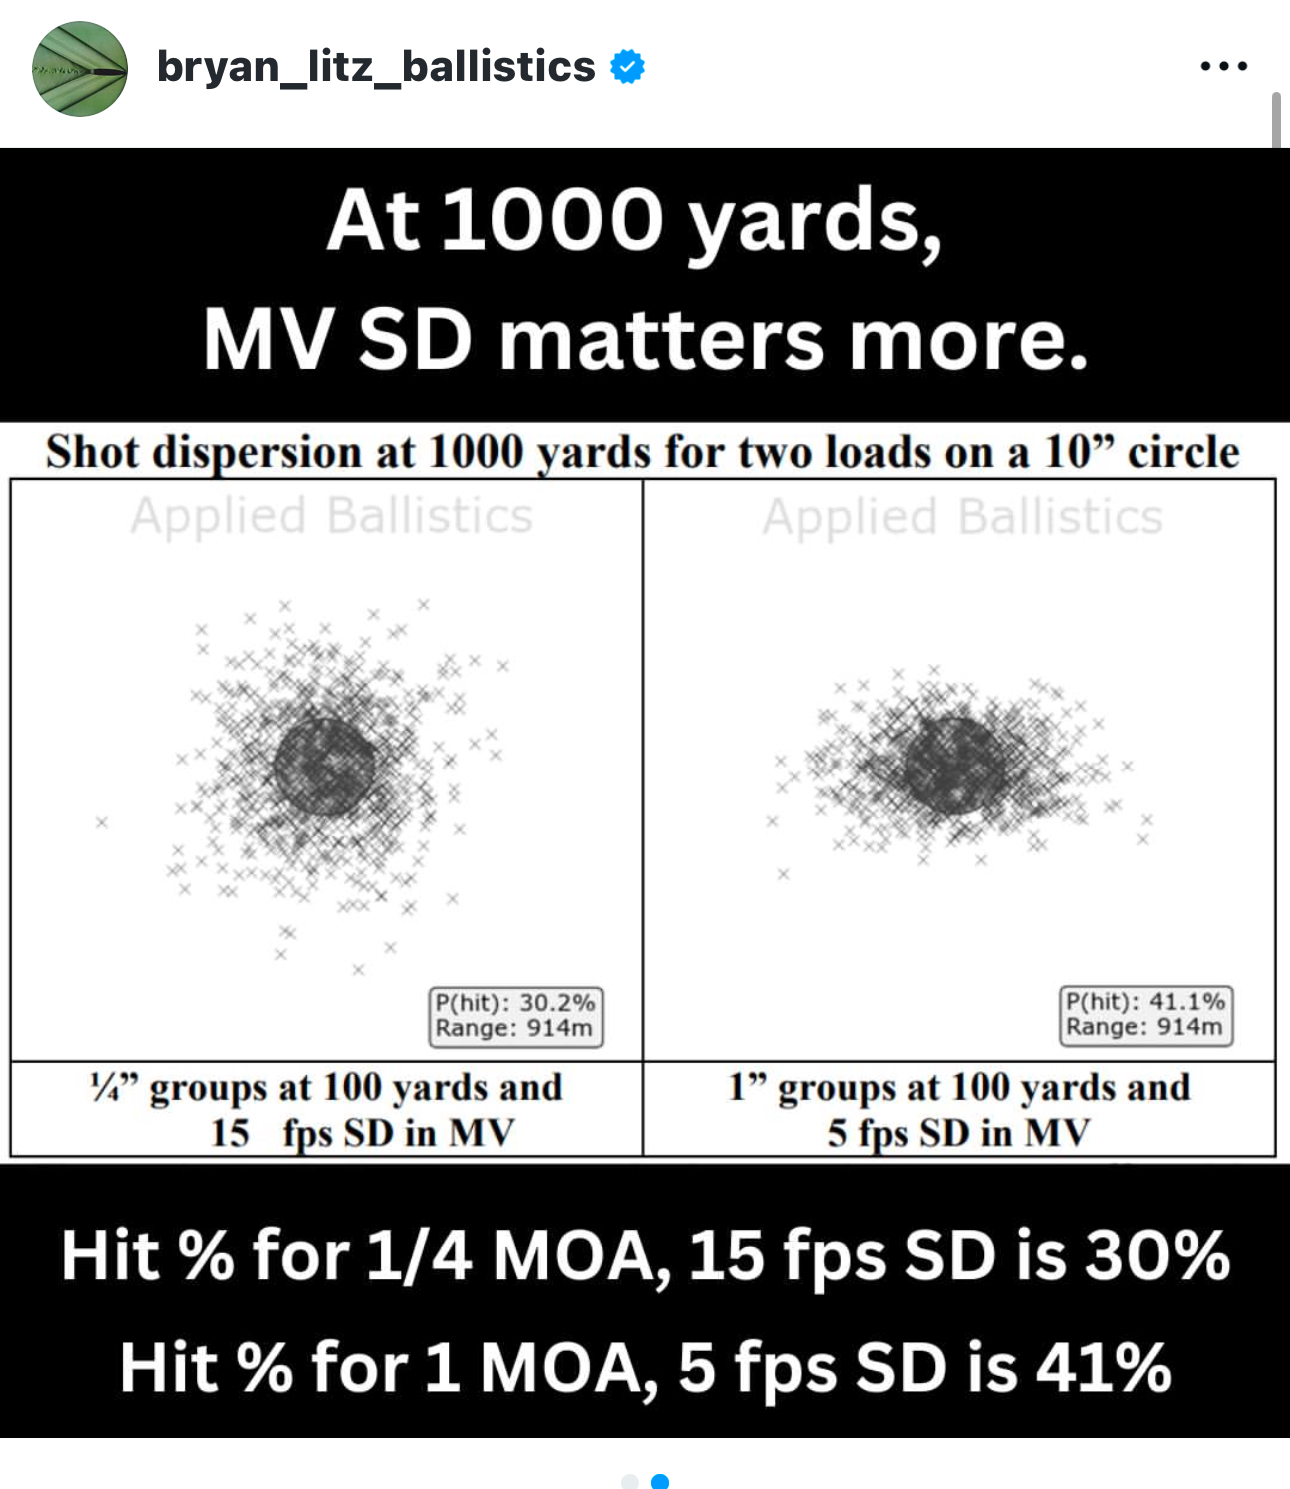
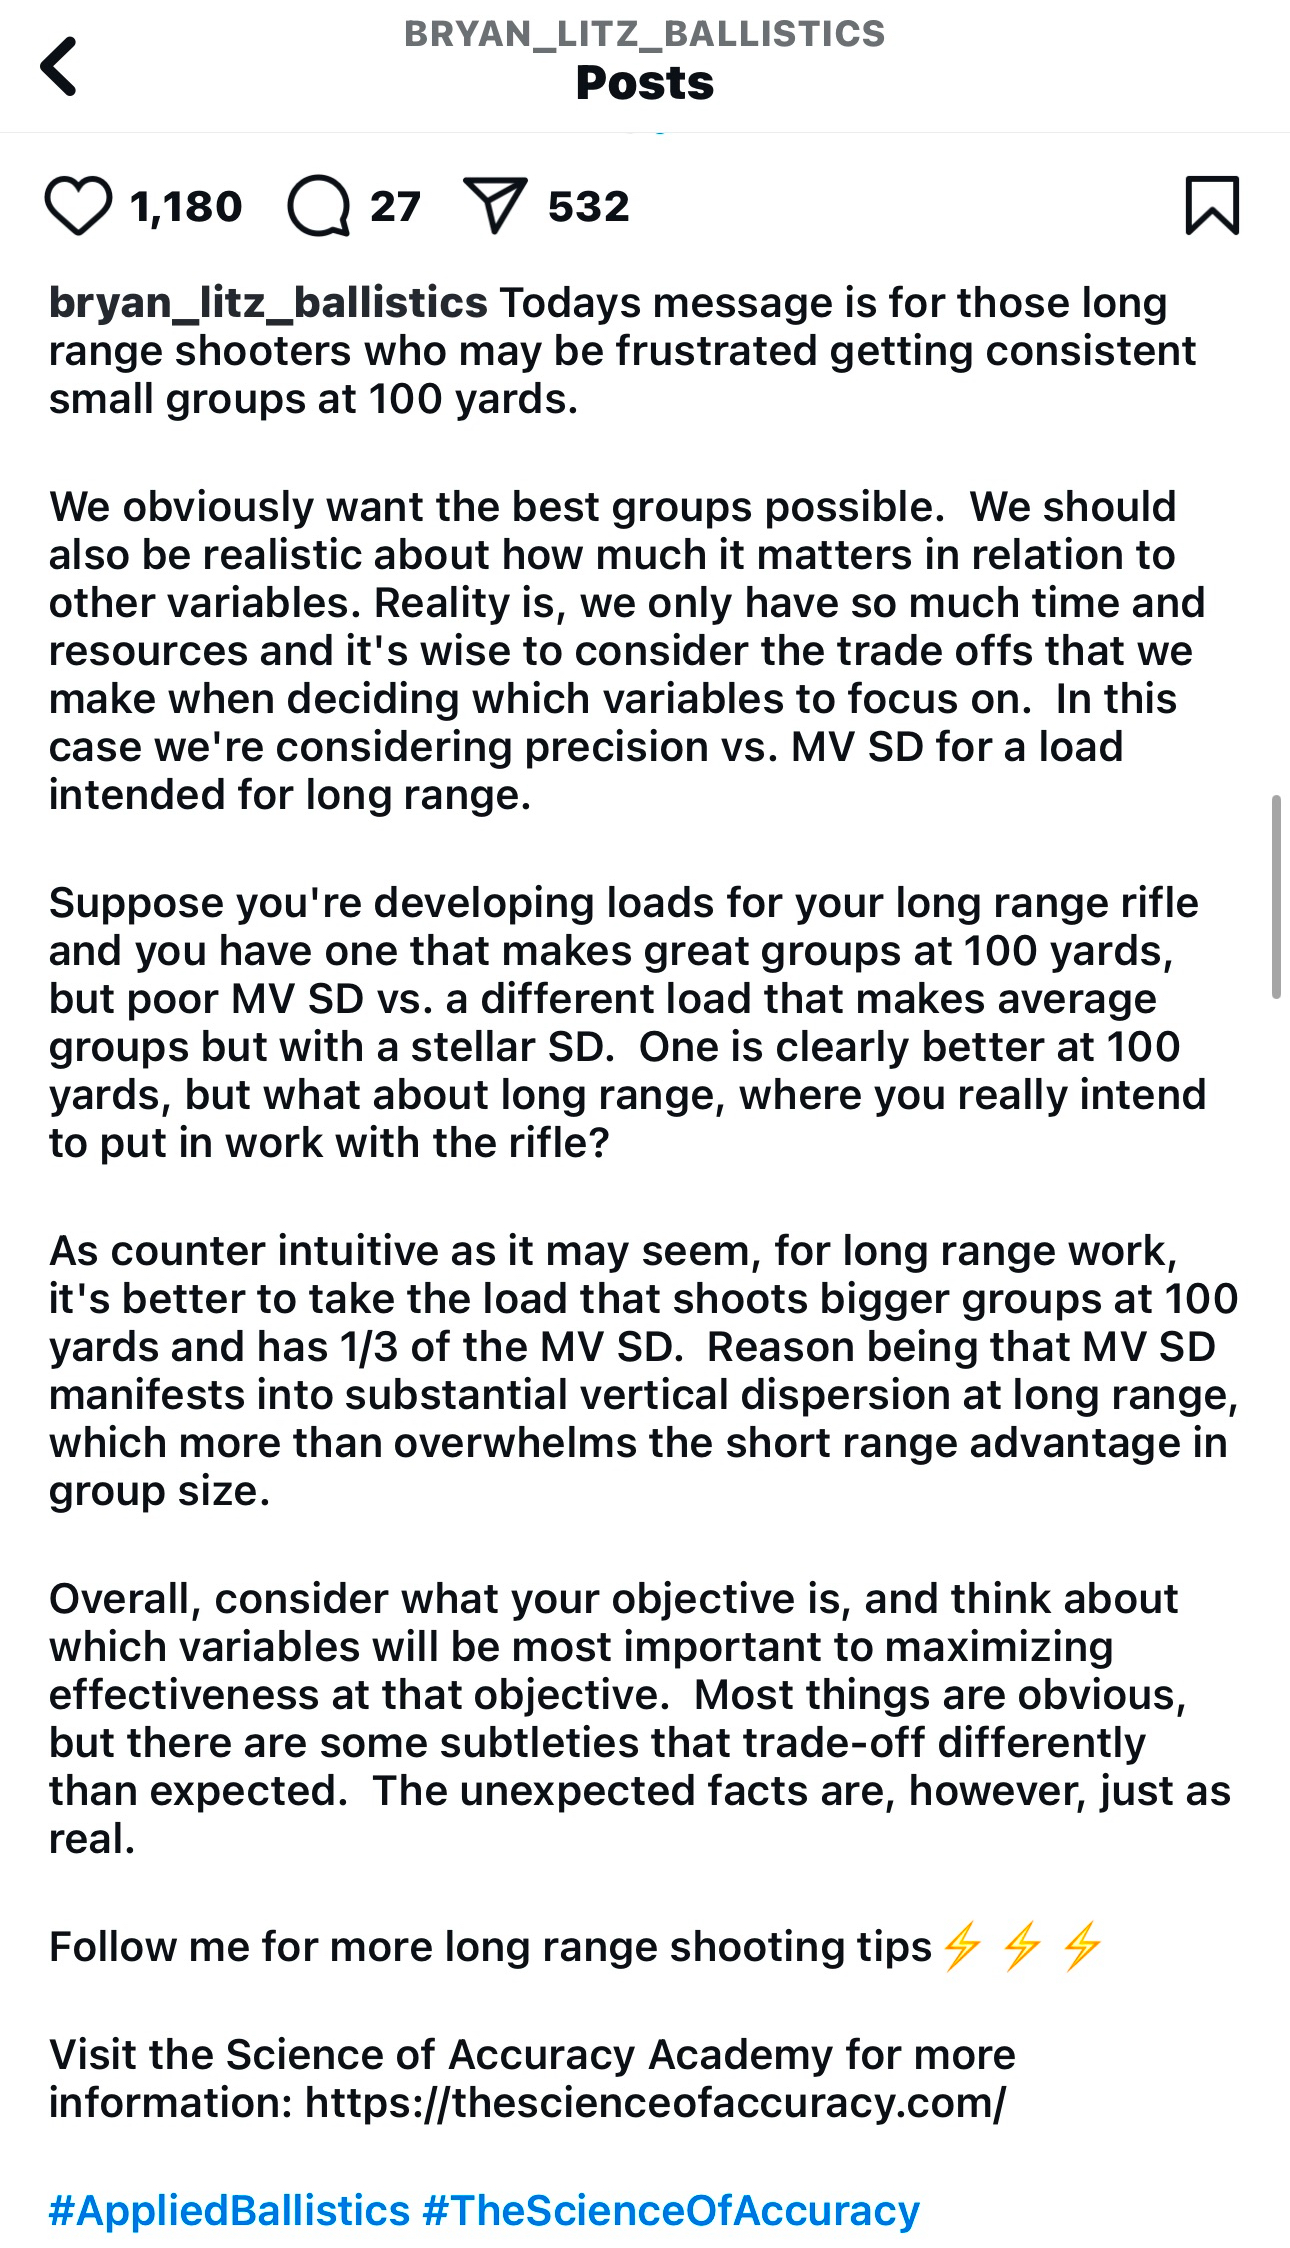
Bryan Litz has some great info on velocities and SDs, was interesting to see that a 1moa rifle with a lower SD was better than a 1/4moa rifle with a slightly higher SD at 1000 yards by a significant margin for hit probability
-
10-01-2025, 02:21 PM #12
Yup. his WEZ provides slightly different parameters to model p(hit) than the free calc I use, but the principle is the same. He's clearly including a wind component where I haven't in numbers above. Either way the principle is very useful to inform what your requirements are.
-
10-01-2025, 04:52 PM #13Member

- Join Date
- May 2020
- Location
- Palmerston North
- Posts
- 277
I somewhat agree. 10 shot samples aren't great, however large enough changes can be shown with smaller sample sizes, and the test takes this into account (although won't be as reliable).
An example where it could be useful: you're trying to get to an SD of 10, and currently it's 15. You make a change and reduce it to 12. Is that 12 a high sample with a true SD of 10, or a low sample and the true SD is still 15? You can then perform the test and see if the change is significant, or you need more samples. However you have to make a decision, what cost do you want to pay to know (be that barrel life, or money).
I think a lot of reloading is reading tea leaves and statistical tests take that out of the process.
-
10-01-2025, 09:47 PM #14Member

- Join Date
- Mar 2012
- Location
- Waikato
- Posts
- 2,188
Thanks Gimp and Magnetite.
Shooters might be interested in the simple explanation of why small string sizes (n) give inaccurate estimates of sd and ES. Same goes for group sizes.
It's just that you have to use the observed sample to estimate the mean value.
The definition of sd is the root mean square of differences from the mean.
We estimate this by adding up the squared differences and estimating the mean value from the sample data, so it is always an under estimate because the sample mean follows the observed values.
A correction for this effect (not sure if it is exact) is to increase the estimate by dividing the sum of squares of the errors by n-1, so the estimated sd becomes larger when the sample size is small. Excel has formulae for both the population sd (STDEV.P) and this adjusterd sample derived estimate of the sd (STDEV.S) so use the STDEV.S on your observed values.
The n-1 number is called the number of "degrees of freedom".
The distribution of these root-mean-square values using n-1 degrees of freedom is called a Students T distribution.
The underlying distribution of the values, which gimp showed in his first graph is the "Normal Distribution" (also called "Gaussian" or "Bell Curve"). It is the limit case when the number of observations trends to infinity. There is an exact formula for the shape, which you can look up in Wikipedia.
In practice, estimates of the mean and standard deviation are very close to those of the underlying Normal distribution when n is greater than 20 or 30.
The Normal distribution is quite amenable to mathematical work, such as calculating the exact standard deviation of a variable which is the sum of two Normal random variables. Interestingly, this applies even if the errors are at right angles like wind and velocity errors. However, the calculus involved is beyond me now (like climbing 1000m in an hour) and using an example like Gimp has done is the only way I could demonstrate the threshold of how many shots it takes to validly compare velocity sd or group size.
Brian Litz is another master of science writing here, simply adding together errors in a mathematically valid way (often based on 95% confidence intervals) in his 'error budget" calculations. My own very limited experience is consistent with his scepticism of meaningfully comparing group sizes from small observed samples (n<20). See his recent "Believe the Target" 2 hr interview with Eric Cortina.
-
11-01-2025, 09:33 AM #15
Similar Threads
-
Adding to the spread
By Rock river arms hunter in forum Game Bird HuntingReplies: 2Last Post: 24-03-2017, 01:27 PM -
"Extreme Velocity Spread"!
By Remington 5R .300 Win Mag in forum Reloading and BallisticsReplies: 60Last Post: 28-10-2013, 09:43 PM -
Extreme spread
By R93 in forum Reloading and BallisticsReplies: 4Last Post: 01-07-2012, 07:46 PM -
Getting movment into your pond decoy spread
By Baz in forum Game Bird HuntingReplies: 10Last Post: 11-04-2012, 11:33 PM -
Welcome & Spread the word that there's a new forum in town
By Philipo in forum IntroductionsReplies: 14Last Post: 25-12-2011, 12:48 AM
Tags for this Thread
Welcome to NZ Hunting and Shooting Forums! We see you're new here, or arn't logged in. Create an account, and Login for full access including our FREE BUY and SELL section Register NOW!!


 25Likes
 LinkBack URL
 About LinkBacks




 Reply With Quote


Bookmarks