Welcome guest, is this your first visit? Create Account now to join.
Welcome to the NZ Hunting and Shooting Forums.
Search Forums
User Tag List
+ Reply to Thread
Results 1 to 15 of 53
Thread: Buggar... scoped moved
Hybrid View
-
23-08-2022, 07:50 PM #1Member

- Join Date
- May 2018
- Location
- wellington
- Posts
- 1,855
-
23-08-2022, 09:18 PM #2Member

- Join Date
- Dec 2012
- Location
- Hamilton
- Posts
- 243
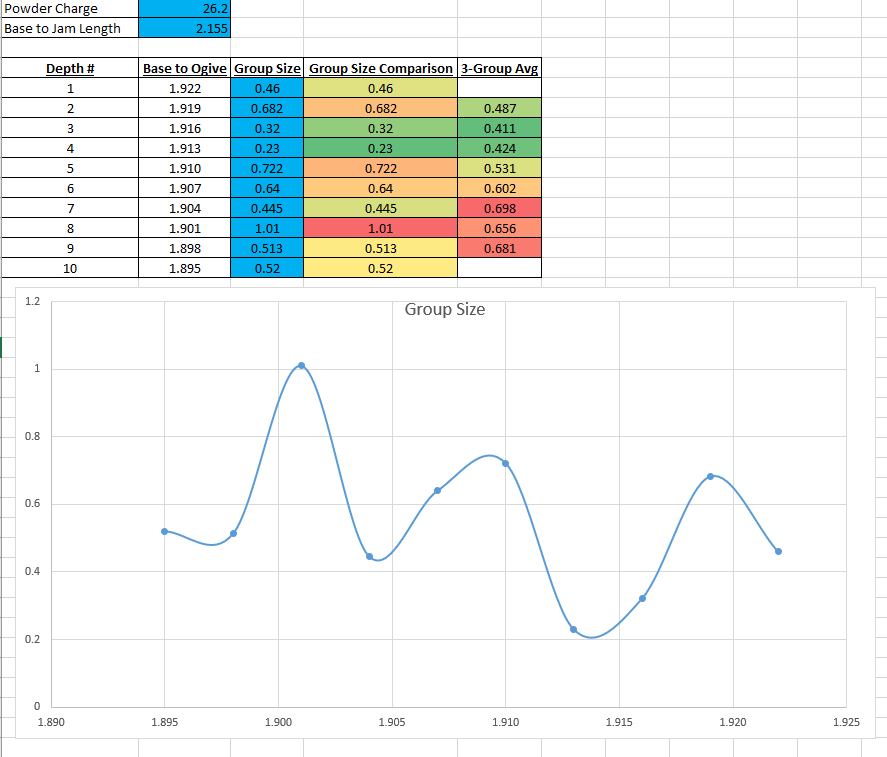
PITA for sure - though to be thorough and sure - I'd start over with the seating testing... cant be left 2nd guessing then, and you can then graph your results and this will indicate where ya nodes lie - 1 vs 2 tight groups etc... then helps lock in a seating depth that allows for wear...

Last edited by Nasty Factory Trigger; 23-08-2022 at 09:21 PM. Reason: a graph!
-
24-08-2022, 10:19 AM #3Member

- Join Date
- Mar 2012
- Location
- Waikato
- Posts
- 2,168
NFT, that's a tour de force.
Looks like a 6mm PPC ?
I don't like the idea of fitting a single curvy line that runs exactly through all the points on your graph. A regression curve that allows for some uncertainty of measurement in each groups size would be more convincing. You can get some idea of that from the way your 3 group average varies by up to 0.2" from the single measurement on the left. Looks like around CBTO 1.915 should be your sweet spot. Nevertheless, very good work and I wish I had data like that.
-
26-08-2022, 08:29 PM #4Member

- Join Date
- Dec 2012
- Location
- Hamilton
- Posts
- 243
223 Rem for 60 gr Vmax
The graph was plotted using Excel - using exact figures. I hear you though not keen on use of a regression curve - we OCD over collection of such results, change seating depths at three thousandths of an inch at a time - there's no way I'm going to use a regression curve to draw a 'best fit' - its either doing something or not - thats my view that may differ from others.
However I'm more OCD on these sort of things! Can be a hinderance in some aspects !
Thanks though.... you too can attain data like this...
You're in my neck of woods - never say never
Similar Threads
-
Moved to Brisbane
By Spitfire in forum HuntingReplies: 21Last Post: 07-10-2020, 08:38 PM -
Moved from Australia to NZ.
By langitaan in forum IntroductionsReplies: 16Last Post: 31-08-2017, 02:20 PM -
G'day just moved from Canada to NZ
By CANKIWI in forum IntroductionsReplies: 20Last Post: 23-12-2015, 05:31 PM
Tags for this Thread
Welcome to NZ Hunting and Shooting Forums! We see you're new here, or arn't logged in. Create an account, and Login for full access including our FREE BUY and SELL section Register NOW!!


 44Likes
 LinkBack URL
 About LinkBacks


 Reply With Quote


Bookmarks