
 44Likes
 LinkBack URL
 About LinkBacks
 Larskramer


NFT, that's a tour de force.Originally Posted by Nasty Factory Trigger

Looks like a 6mm PPC ?
I don't like the idea of fitting a single curvy line that runs exactly through all the points on your graph. A regression curve that allows for some uncertainty of measurement in each groups size would be more convincing. You can get some idea of that from the way your 3 group average varies by up to 0.2" from the single measurement on the left. Looks like around CBTO 1.915 should be your sweet spot. Nevertheless, very good work and I wish I had data like that.
Welcome guest, is this your first visit? Create Account now to join.
Welcome to the NZ Hunting and Shooting Forums.
Search Forums


User Tag List
Results 1 to 15 of 53
Thread: Buggar... scoped moved
Threaded View
-
24-08-2022, 10:19 AM #9Member

- Join Date
- Mar 2012
- Location
- Waikato
- Posts
- 2,166


 Reply With Quote
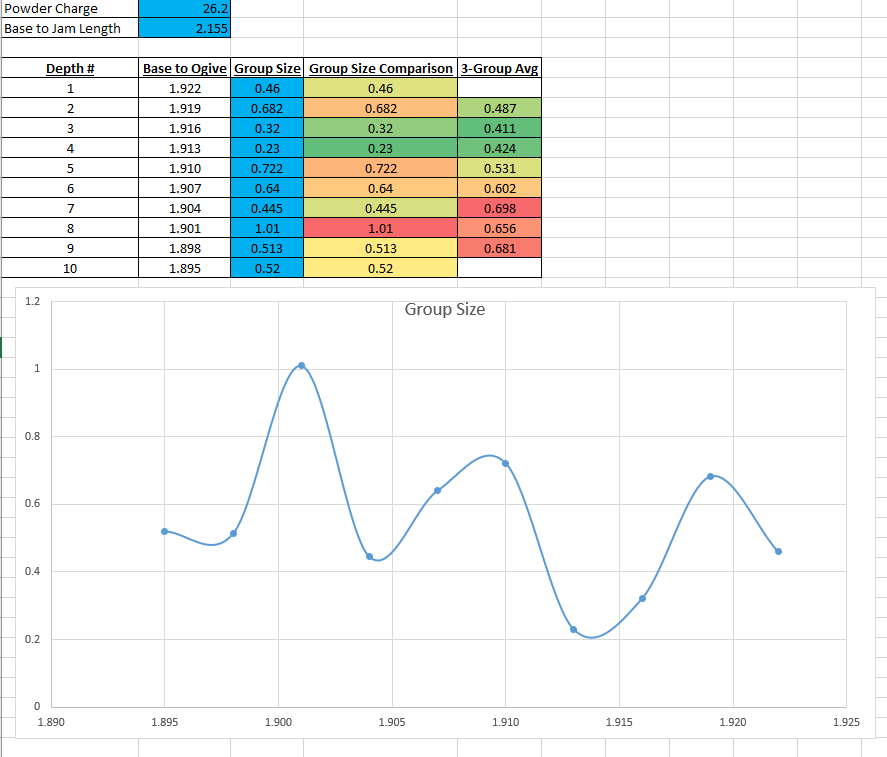
Similar Threads
-
Moved to Brisbane
By Spitfire in forum HuntingReplies: 21Last Post: 07-10-2020, 08:38 PM -
Moved from Australia to NZ.
By langitaan in forum IntroductionsReplies: 16Last Post: 31-08-2017, 02:20 PM -
G'day just moved from Canada to NZ
By CANKIWI in forum IntroductionsReplies: 20Last Post: 23-12-2015, 05:31 PM
Tags for this Thread
 Posting Permissions
- You may not post new threads
- You may not post replies
- You may not post attachments
- You may not edit your posts
Welcome to NZ Hunting and Shooting Forums! We see you're new here, or arn't logged in. Create an account, and Login for full access including our FREE BUY and SELL section Register NOW!!
All times are GMT +13. The time now is 09:35 PM.

Bookmarks