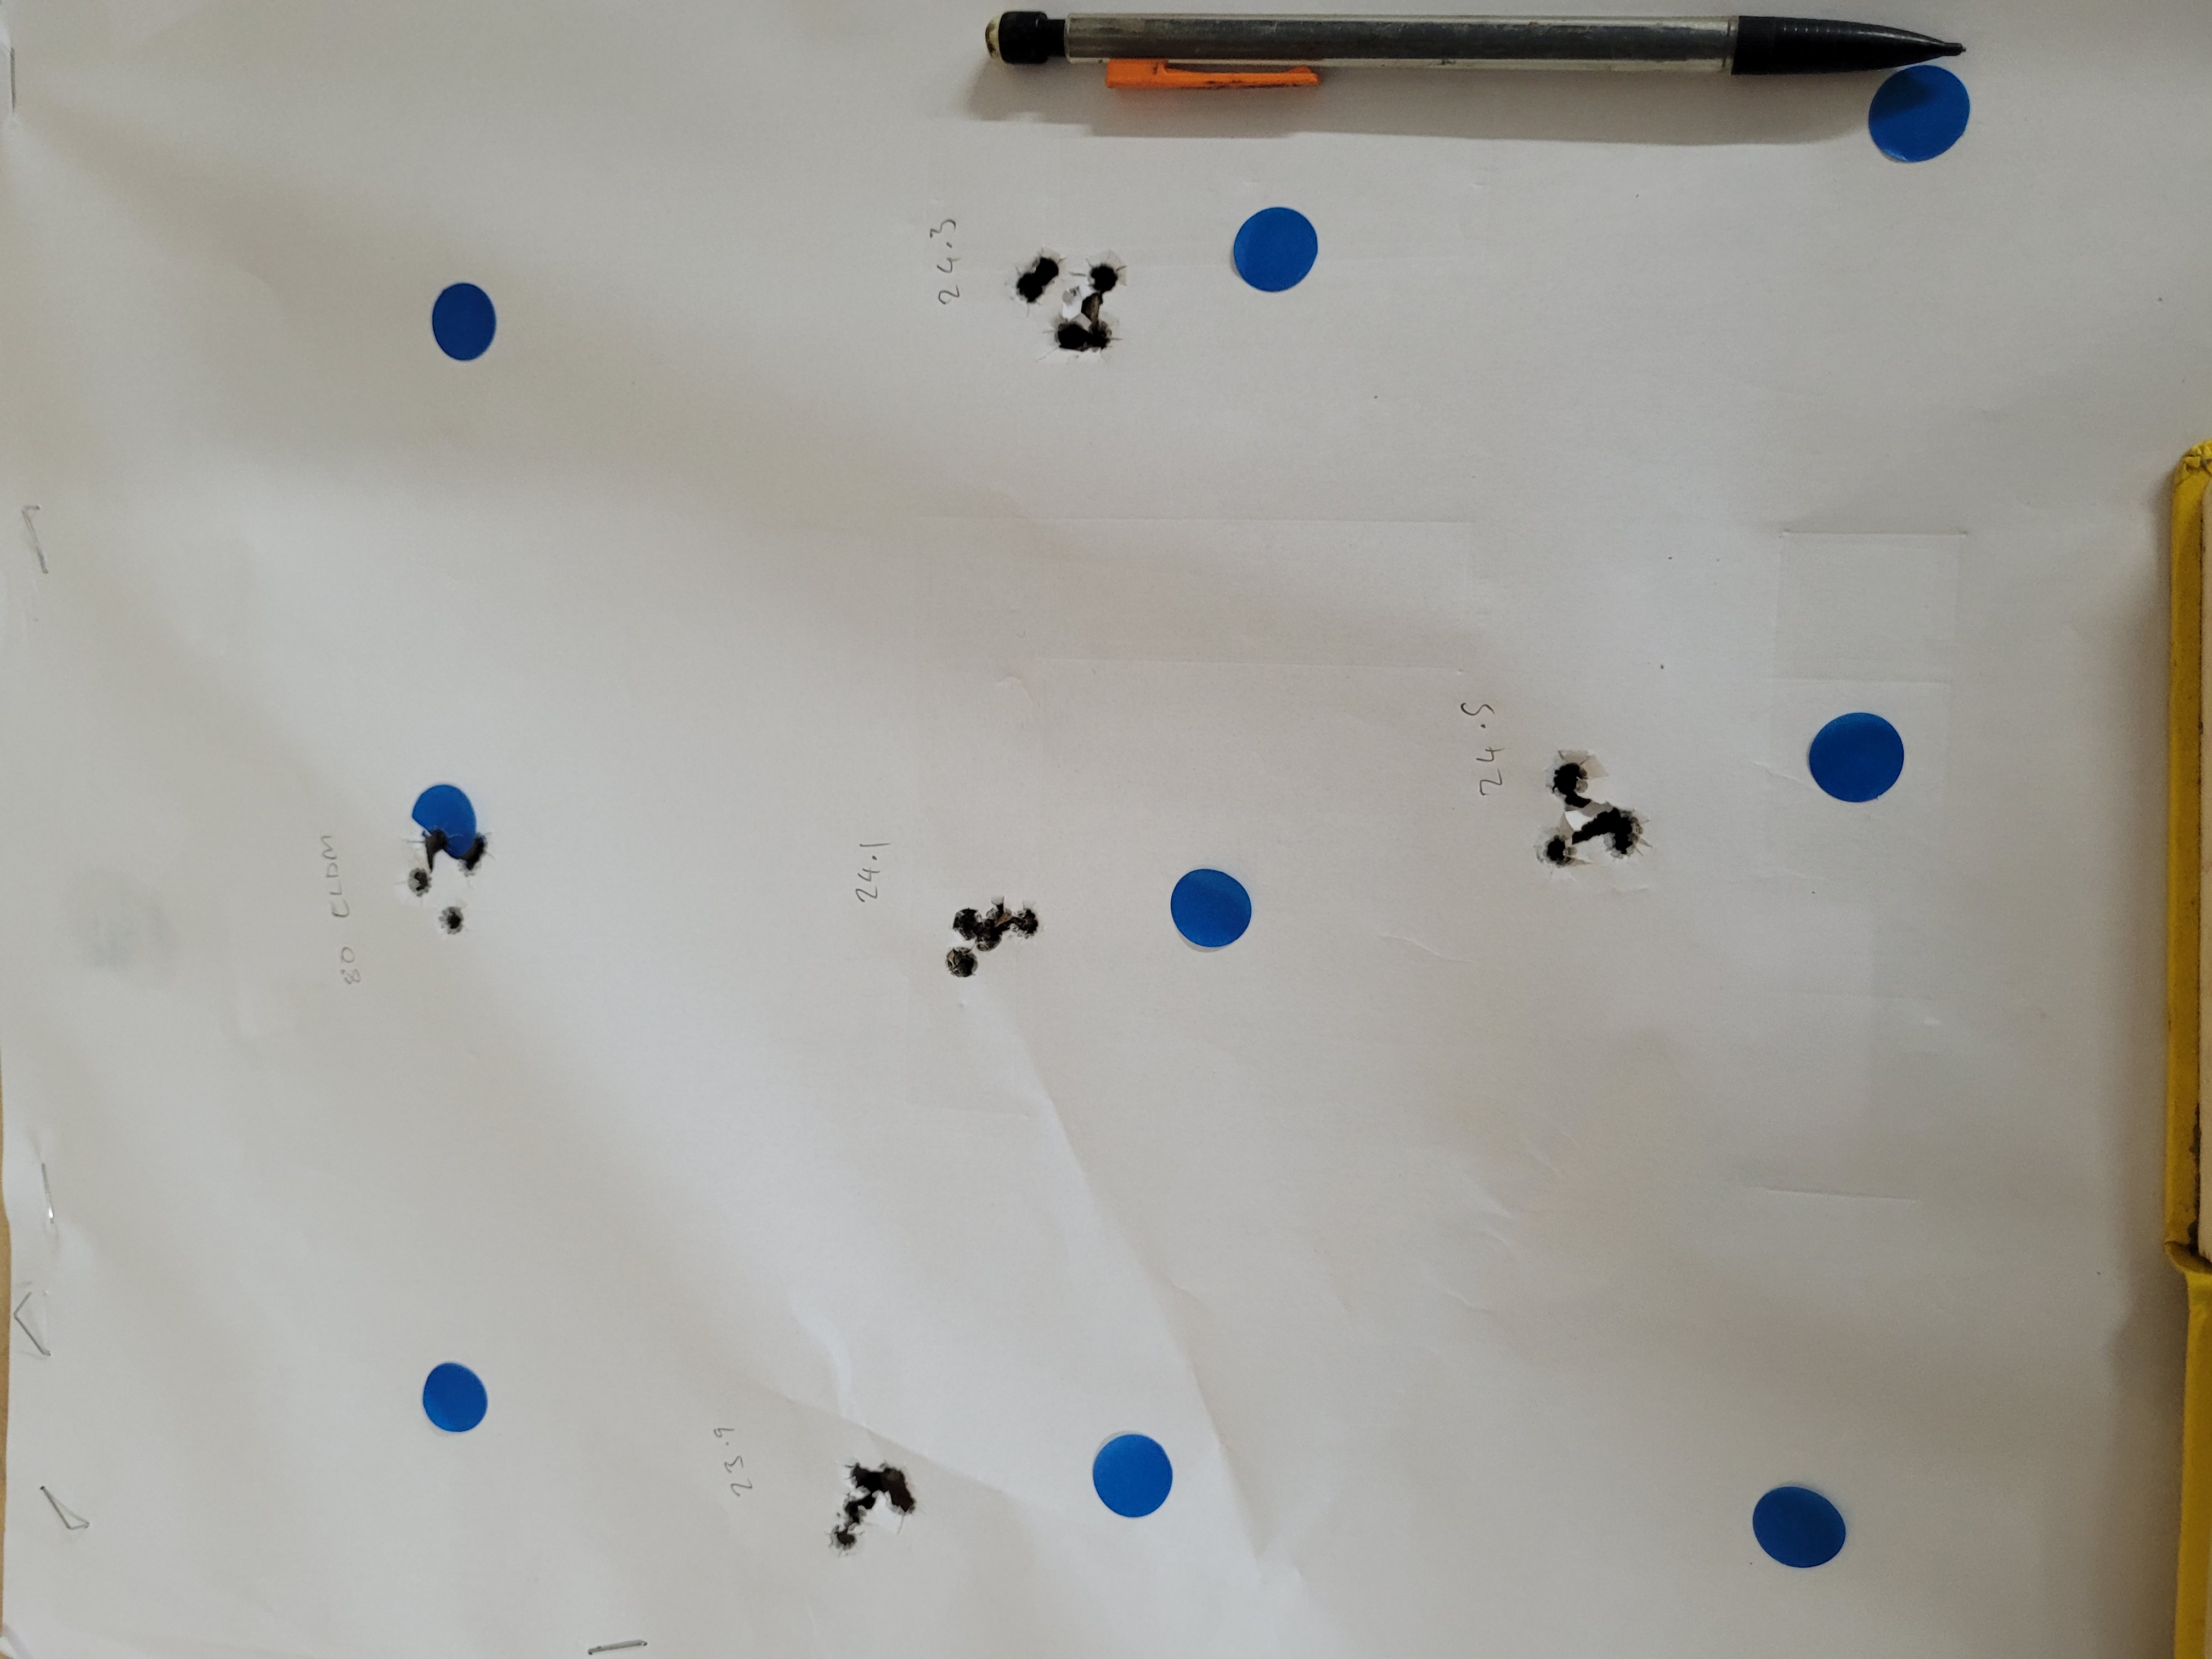
It does exactly the same thing with this load from cold, the first shot normally being in the group. The trigger is Bergara factory stock, set at 2 its 4 oz with an excellent let-off, it's a very nice package all round.
Have you got photos of multiple groups where this has happened? What do they look like overlaid? Is the "flier" an identifiable shot # ?
My barrel is 18 inch.
Funny how my load development process has changed since I started this thread. 1st post was the 1st load development I'd done in years - and the last following the old method.
My load development is "no load development" - shoot over chrony till velocity is good. Shoot test groups of 10. I'll dig out some more targets.
Note it's a fucking hassle loading more than 1 bullet per rifle in my opinion. This exercise in doing just that is precisely to prevent ever doing it again.
Seating depths left the same as my 80 ELDM load where possible and otherwise BTO to lands roughly measured using a Hornady gauge and seating die screwed down til it was something shorter than that
So a photo of a group with its "non preferred" projectile might be usefull . . .
Both 10 shot groups, the two "x"s in the bottom one are shots I had to put at another aiming point cause the f ing target folded over in the wind haha
What is the mean radius for each of those groups with the bullet it "likes"?
Mean radius for three of the best groups ( had to go back and redo them because I'd been "cheating") and leaving out the worst shot ha bloody ha)
1.27 cm/0.44moa
0.85 cm/0.29moa
And another at
0.85 cm/0.29 moa.
So if you can help me understand mean radius I'd be very grateful.
Mean radius is just a better measure than group size, for measuring precision. It is less sensitive to outliers. Really you do need more rounds to measure mean radius accurately but I find for my purposes 10 is practical.
It is a bit hard to tell what is going on with your situation. What does the total group of 30 look like if you overlay them? It's really hard to tell what is POA etc from your targets.
It's possible the "fliers" you are seeing are just outliers in the real group. If it's not that and they're outside the overlaid group, you have a rifle (or shooter) issue of some kind.
I'm not sure how to combine them, I've changed scopes, stocks and left the suppressor at home which is why they are all over the paper, is there a way of doing it electronically?
Not easily if you've changed parts of the system or made adjustments so there isn't a consistent reference point. It looks like a rifle or shooter issue rather than a reloading issue anyway.
Like for these 3 groups I adjusted down .5, down 1, and then back to zero and left .5. The POI for all 3 groups is about .1 left of adjusted POA (actually right, but the pic is upside down.....). You can visually imagine them all overlaid and they're all inside the footprint of the largest group, so it's really like a 0.7moa 30rd group.
To actually overlay them I do it in excel and enter the X/Y coordinates then plot them all on one graph
e.g. this is the 3 groups above plotted on one graph, overlaid - you can see relative point of impact for all shots. Each group is just another data series. The units on the axes are 0.1MRAD.
You can also calculate the radius for all shots from all groups and the overall mean radius.
I can email you a spreadsheet template and instructions if you want
Bookmarks